04. Finding the Lines: Sliding Window

Implement Sliding Windows and Fit a Polynomial

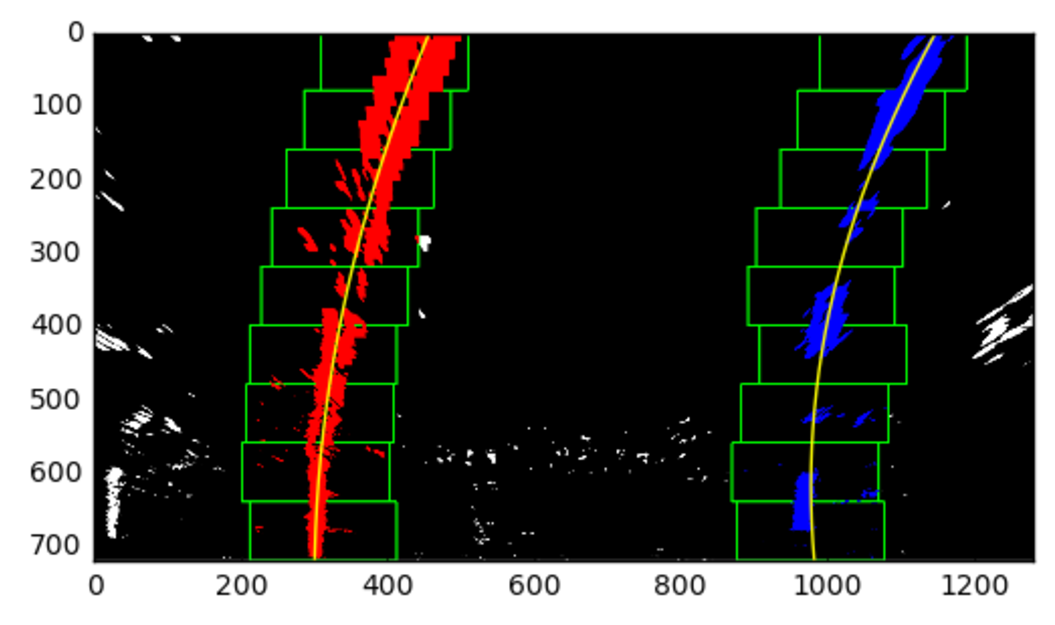
As shown in the previous animation, we can use the two highest peaks from our histogram as a starting point for determining where the lane lines are, and then use sliding windows moving upward in the image (further along the road) to determine where the lane lines go.

Split the histogram for the two lines

The first step we'll take is to split the histogram into two sides, one for each lane line.

import numpy as np
import cv2
import matplotlib.pyplot as plt

# Assuming you have created a warped binary image called "binary_warped"
# Take a histogram of the bottom half of the image
histogram = np.sum(binary_warped[binary_warped.shape[0]//2:,:], axis=0)
# Create an output image to draw on and visualize the result
out_img = np.dstack((binary_warped, binary_warped, binary_warped))*255
# Find the peak of the left and right halves of the histogram
# These will be the starting point for the left and right lines
midpoint = np.int(histogram.shape[0]//2)
leftx_base = np.argmax(histogram[:midpoint])
rightx_base = np.argmax(histogram[midpoint:]) + midpoint

Note that in the above, we also create out_img to help with visualizing our output later on.

Set up windows and window hyperparameters

Our next step is to set a few hyperparameters related to our sliding windows, and set them up to iterate across the binary activations in the image. We have some base hyperparameters below, but don't forget to try out different values in your own implementation to see what works best!

# HYPERPARAMETERS
# Choose the number of sliding windows
nwindows = 9
# Set the width of the windows +/- margin
margin = 100
# Set minimum number of pixels found to recenter window
minpix = 50

# Set height of windows - based on nwindows above and image shape
window_height = np.int(binary_warped.shape[0]//nwindows)
# Identify the x and y positions of all nonzero (i.e. activated) pixels in the image
nonzero = binary_warped.nonzero()
nonzeroy = np.array(nonzero[0])
nonzerox = np.array(nonzero[1])
# Current positions to be updated later for each window in nwindows
leftx_current = leftx_base
rightx_current = rightx_base

# Create empty lists to receive left and right lane pixel indices
left_lane_inds = []
right_lane_inds = []

Iterate through nwindows to track curvature

Now that we've set up what the windows look like and have a starting point, we'll want to loop for nwindows , with the given window sliding left or right if it finds the mean position of activated pixels within the window to have shifted.

You'll implement this part in the quiz below, but here's a few steps to get you started:

  1. Loop through each window in nwindows
  2. Find the boundaries of our current window. This is based on a combination of the current window's starting point ( leftx_current and rightx_current ), as well as the margin you set in the hyperparameters.
  3. Use cv2.rectangle to draw these window boundaries onto our visualization image out_img . This is required for the quiz, but you can skip this step in practice if you don't need to visualize where the windows are.
  4. Now that we know the boundaries of our window, find out which activated pixels from nonzeroy and nonzerox above actually fall into the window.
  5. Append these to our lists left_lane_inds and right_lane_inds .
  6. If the number of pixels you found in Step 4 are greater than your hyperparameter minpix , re-center our window (i.e. leftx_current or rightx_current ) based on the mean position of these pixels.

Fit a polynomial

Now that we have found all our pixels belonging to each line through the sliding window method, it's time to fit a polynomial to the line. First, we have a couple small steps to ready our pixels.

# Concatenate the arrays of indices (previously was a list of lists of pixels)
left_lane_inds = np.concatenate(left_lane_inds)
right_lane_inds = np.concatenate(right_lane_inds)

# Extract left and right line pixel positions
leftx = nonzerox[left_lane_inds]
lefty = nonzeroy[left_lane_inds] 
rightx = nonzerox[right_lane_inds]
righty = nonzeroy[right_lane_inds]

We'll let you implement the function for the polynomial in the quiz below using np.polyfit .

# Assuming we have `left_fit` and `right_fit` from `np.polyfit` before
# Generate x and y values for plotting
ploty = np.linspace(0, binary_warped.shape[0]-1, binary_warped.shape[0])
left_fitx = left_fit[0]*ploty**2 + left_fit[1]*ploty + left_fit[2]
right_fitx = right_fit[0]*ploty**2 + right_fit[1]*ploty + right_fit[2]

Take note of how we fit the lines above - while normally you calculate a y-value for a given x, here we do the opposite. Why? Because we expect our lane lines to be (mostly) vertically-oriented.

Visualization

Once you reach this point, you're done! But here is how you can visualize the result as well:

out_img[lefty, leftx] = [255, 0, 0]
out_img[righty, rightx] = [0, 0, 255]

plt.imshow(out_img)
plt.plot(left_fitx, ploty, color='yellow')
plt.plot(right_fitx, ploty, color='yellow')
plt.xlim(0, 1280)
plt.ylim(720, 0)

Quiz

In the below quiz, implement the following (see TO-DO 's):

  • Steps 2, 4 and 6 from above within the for loop in find_lane_pixels() - find the window boundaries, find all pixels within those boundaries, and if there are more than minpix , slide the window over to the mean of these pixels.
  • Fit a polynomial to all the relevant pixels you've found in your sliding windows in fit_polynomial() .

Start Quiz:

import numpy as np
import matplotlib.image as mpimg
import matplotlib.pyplot as plt
import cv2

# Load our image
binary_warped = mpimg.imread('warped_example.jpg')

def find_lane_pixels(binary_warped):
    # Take a histogram of the bottom half of the image
    histogram = np.sum(binary_warped[binary_warped.shape[0]//2:,:], axis=0)
    # Create an output image to draw on and visualize the result
    out_img = np.dstack((binary_warped, binary_warped, binary_warped))
    # Find the peak of the left and right halves of the histogram
    # These will be the starting point for the left and right lines
    midpoint = np.int(histogram.shape[0]//2)
    leftx_base = np.argmax(histogram[:midpoint])
    rightx_base = np.argmax(histogram[midpoint:]) + midpoint

    # HYPERPARAMETERS
    # Choose the number of sliding windows
    nwindows = 9
    # Set the width of the windows +/- margin
    margin = 100
    # Set minimum number of pixels found to recenter window
    minpix = 50

    # Set height of windows - based on nwindows above and image shape
    window_height = np.int(binary_warped.shape[0]//nwindows)
    # Identify the x and y positions of all nonzero pixels in the image
    nonzero = binary_warped.nonzero()
    nonzeroy = np.array(nonzero[0])
    nonzerox = np.array(nonzero[1])
    # Current positions to be updated later for each window in nwindows
    leftx_current = leftx_base
    rightx_current = rightx_base

    # Create empty lists to receive left and right lane pixel indices
    left_lane_inds = []
    right_lane_inds = []

    # Step through the windows one by one
    for window in range(nwindows):
        # Identify window boundaries in x and y (and right and left)
        win_y_low = binary_warped.shape[0] - (window+1)*window_height
        win_y_high = binary_warped.shape[0] - window*window_height
        ### TO-DO: Find the four below boundaries of the window ###
        win_xleft_low = 0  # Update this
        win_xleft_high = 0  # Update this
        win_xright_low = 0  # Update this
        win_xright_high = 0  # Update this
        
        # Draw the windows on the visualization image
        cv2.rectangle(out_img,(win_xleft_low,win_y_low),
        (win_xleft_high,win_y_high),(0,255,0), 2) 
        cv2.rectangle(out_img,(win_xright_low,win_y_low),
        (win_xright_high,win_y_high),(0,255,0), 2) 
        
        ### TO-DO: Identify the nonzero pixels in x and y within the window ###
        good_left_inds = None
        good_right_inds = None
        
        # Append these indices to the lists
        left_lane_inds.append(good_left_inds)
        right_lane_inds.append(good_right_inds)
        
        ### TO-DO: If you found > minpix pixels, recenter next window ###
        ### (`right` or `leftx_current`) on their mean position ###
        pass # Remove this when you add your function

    # Concatenate the arrays of indices (previously was a list of lists of pixels)
    try:
        left_lane_inds = np.concatenate(left_lane_inds)
        right_lane_inds = np.concatenate(right_lane_inds)
    except ValueError:
        # Avoids an error if the above is not implemented fully
        pass

    # Extract left and right line pixel positions
    leftx = nonzerox[left_lane_inds]
    lefty = nonzeroy[left_lane_inds] 
    rightx = nonzerox[right_lane_inds]
    righty = nonzeroy[right_lane_inds]

    return leftx, lefty, rightx, righty, out_img


def fit_polynomial(binary_warped):
    # Find our lane pixels first
    leftx, lefty, rightx, righty, out_img = find_lane_pixels(binary_warped)

    ### TO-DO: Fit a second order polynomial to each using `np.polyfit` ###
    left_fit = None
    right_fit = None

    # Generate x and y values for plotting
    ploty = np.linspace(0, binary_warped.shape[0]-1, binary_warped.shape[0] )
    try:
        left_fitx = left_fit[0]*ploty**2 + left_fit[1]*ploty + left_fit[2]
        right_fitx = right_fit[0]*ploty**2 + right_fit[1]*ploty + right_fit[2]
    except TypeError:
        # Avoids an error if `left` and `right_fit` are still none or incorrect
        print('The function failed to fit a line!')
        left_fitx = 1*ploty**2 + 1*ploty
        right_fitx = 1*ploty**2 + 1*ploty

    ## Visualization ##
    # Colors in the left and right lane regions
    out_img[lefty, leftx] = [255, 0, 0]
    out_img[righty, rightx] = [0, 0, 255]

    # Plots the left and right polynomials on the lane lines
    plt.plot(left_fitx, ploty, color='yellow')
    plt.plot(right_fitx, ploty, color='yellow')

    return out_img


out_img = fit_polynomial(binary_warped)

plt.imshow(out_img)
import numpy as np
import matplotlib.image as mpimg
import matplotlib.pyplot as plt
import cv2

# Load our image
binary_warped = mpimg.imread('warped_example.jpg')

def find_lane_pixels(binary_warped):
    # Take a histogram of the bottom half of the image
    histogram = np.sum(binary_warped[binary_warped.shape[0]//2:,:], axis=0)
    # Create an output image to draw on and visualize the result
    out_img = np.dstack((binary_warped, binary_warped, binary_warped))
    # Find the peak of the left and right halves of the histogram
    # These will be the starting point for the left and right lines
    midpoint = np.int(histogram.shape[0]//2)
    leftx_base = np.argmax(histogram[:midpoint])
    rightx_base = np.argmax(histogram[midpoint:]) + midpoint

    # HYPERPARAMETERS
    # Choose the number of sliding windows
    nwindows = 9
    # Set the width of the windows +/- margin
    margin = 100
    # Set minimum number of pixels found to recenter window
    minpix = 50

    # Set height of windows - based on nwindows above and image shape
    window_height = np.int(binary_warped.shape[0]//nwindows)
    # Identify the x and y positions of all nonzero pixels in the image
    nonzero = binary_warped.nonzero()
    nonzeroy = np.array(nonzero[0])
    nonzerox = np.array(nonzero[1])
    # Current positions to be updated later for each window in nwindows
    leftx_current = leftx_base
    rightx_current = rightx_base

    # Create empty lists to receive left and right lane pixel indices
    left_lane_inds = []
    right_lane_inds = []

    # Step through the windows one by one
    for window in range(nwindows):
        # Identify window boundaries in x and y (and right and left)
        win_y_low = binary_warped.shape[0] - (window+1)*window_height
        win_y_high = binary_warped.shape[0] - window*window_height
        win_xleft_low = leftx_current - margin
        win_xleft_high = leftx_current + margin
        win_xright_low = rightx_current - margin
        win_xright_high = rightx_current + margin
        
        # Draw the windows on the visualization image
        cv2.rectangle(out_img,(win_xleft_low,win_y_low),
        (win_xleft_high,win_y_high),(0,255,0), 2) 
        cv2.rectangle(out_img,(win_xright_low,win_y_low),
        (win_xright_high,win_y_high),(0,255,0), 2) 
        
        # Identify the nonzero pixels in x and y within the window #
        good_left_inds = ((nonzeroy >= win_y_low) & (nonzeroy < win_y_high) & 
        (nonzerox >= win_xleft_low) &  (nonzerox < win_xleft_high)).nonzero()[0]
        good_right_inds = ((nonzeroy >= win_y_low) & (nonzeroy < win_y_high) & 
        (nonzerox >= win_xright_low) &  (nonzerox < win_xright_high)).nonzero()[0]
        
        # Append these indices to the lists
        left_lane_inds.append(good_left_inds)
        right_lane_inds.append(good_right_inds)
        
        # If you found > minpix pixels, recenter next window on their mean position
        if len(good_left_inds) > minpix:
            leftx_current = np.int(np.mean(nonzerox[good_left_inds]))
        if len(good_right_inds) > minpix:        
            rightx_current = np.int(np.mean(nonzerox[good_right_inds]))

    # Concatenate the arrays of indices (previously was a list of lists of pixels)
    try:
        left_lane_inds = np.concatenate(left_lane_inds)
        right_lane_inds = np.concatenate(right_lane_inds)
    except ValueError:
        # Avoids an error if the above is not implemented fully
        pass

    # Extract left and right line pixel positions
    leftx = nonzerox[left_lane_inds]
    lefty = nonzeroy[left_lane_inds] 
    rightx = nonzerox[right_lane_inds]
    righty = nonzeroy[right_lane_inds]

    return leftx, lefty, rightx, righty, out_img


def fit_polynomial(binary_warped):
    # Find our lane pixels first
    leftx, lefty, rightx, righty, out_img = find_lane_pixels(binary_warped)

    # Fit a second order polynomial to each using `np.polyfit`
    left_fit = np.polyfit(lefty, leftx, 2)
    right_fit = np.polyfit(righty, rightx, 2)

    # Generate x and y values for plotting
    ploty = np.linspace(0, binary_warped.shape[0]-1, binary_warped.shape[0] )
    try:
        left_fitx = left_fit[0]*ploty**2 + left_fit[1]*ploty + left_fit[2]
        right_fitx = right_fit[0]*ploty**2 + right_fit[1]*ploty + right_fit[2]
    except TypeError:
        # Avoids an error if `left` and `right_fit` are still none or incorrect
        print('The function failed to fit a line!')
        left_fitx = 1*ploty**2 + 1*ploty
        right_fitx = 1*ploty**2 + 1*ploty

    ## Visualization ##
    # Colors in the left and right lane regions
    out_img[lefty, leftx] = [255, 0, 0]
    out_img[righty, rightx] = [0, 0, 255]

    # Plots the left and right polynomials on the lane lines
    plt.plot(left_fitx, ploty, color='yellow')
    plt.plot(right_fitx, ploty, color='yellow')

    return out_img


out_img = fit_polynomial(binary_warped)

plt.imshow(out_img)